Tribal Numbers: Count Us, Then Account to Us
What Kenya’s voter demographics reveal about the people hidden inside political arithmetic.
On this page
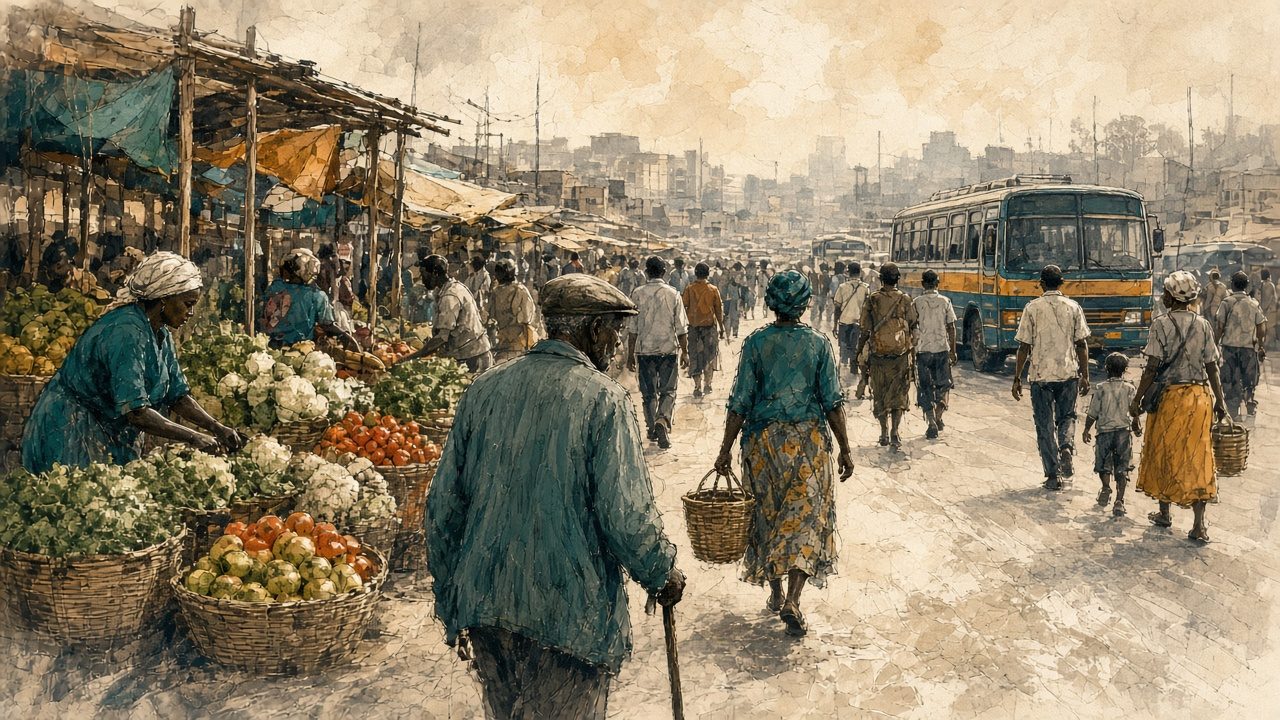
Conceptual editorial image, not a documentary photograph or ethnic map. A busy shared market and street scene: produce stalls, soft transport corridor, pedestrians of varied ages navigating one public space. Central idea: people counted in political arithmetic are also workers, traders, carers and neighbours whose circumstances representation should address.
Our Numbers
Imagine a trader closing the day’s books. There is stock to replace, transport to pay for, a supplier asking for settlement and school fees approaching.
Then the political conversation begins, and this complicated human being becomes something remarkably simple: one of “our numbers”.
The trader’s circumstances disappear into a regional total. The regional total acquires an ethnic label. Someone then claims the authority to deliver it.
That is the point at which counting citizens becomes a claim of ownership.
Illustrative market stall and ledger on the left; abstract counting marks and a regional total on the right. No ethnic map; no named person.
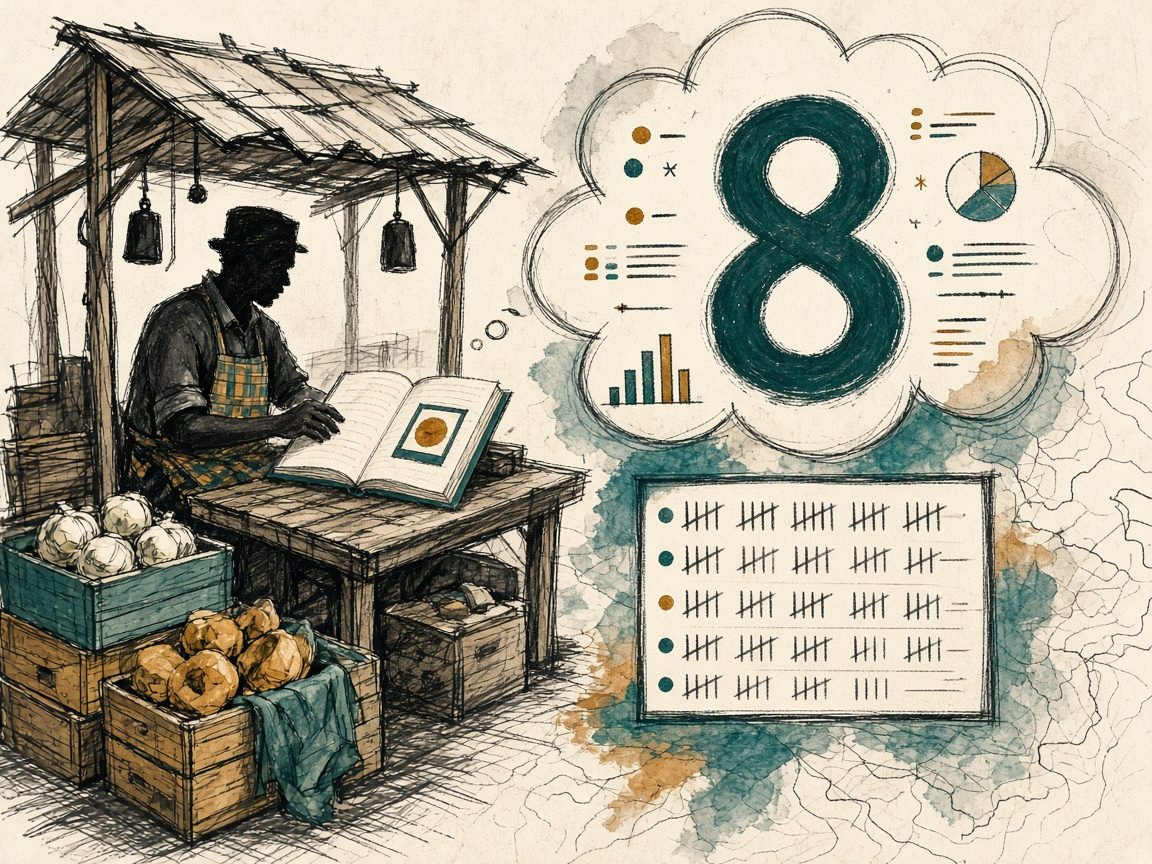
The scene is illustrative, not an interview. It names a habit that runs through Kenyan political talk: treat registration geography as if it were ethnic loyalty, then treat that loyalty as transferable property. Cultural belonging matters. Historical grievance matters. People can share an identity and still disagree. What does not follow from a regional registration figure is the right to speak for every person inside it, or to deliver their votes as cargo.
Examine the Arithmetic
Keep the quantities distinct. Population is not the same as eligible adults. Eligible adults are not the same as registered voters. Registered voters are not the same as people who turn out. Turnout is not the same as votes received by a candidate. Each step needs additional evidence.
01
Population
Residents
02
Eligible adults
Age-qualified
03
Registered voters
On the roll
04
People who vote
Turnout
05
Votes for a candidate
Choice
Five ascending platforms suggesting population through votes for a candidate, with question-mark gaps between steps. Conceptual labels only.

A regional registration total can tell us how many people on the 2022 register lived in a former province. It cannot, by itself, establish turnout, ethnic composition, uniform preference or the transferability of votes after an endorsement. When commentary collapses those steps, arithmetic becomes theatre.
This essay does not explain the last election or forecast the next one. It asks a narrower question: what do verified age, gender and livelihood patterns show about the people hidden inside political arithmetic, and what representation should do with that knowledge?
Age and Gender First
Start with who is counted. In 2022 Kenya had 22,120,458 registered voters. Women were 10,866,419 (49.12%); men 11,254,039 (50.88%). Ages 18-34, calculated from Annex V of the IEBC evaluation report, were 9,027,518 (40.81%). The report’s narrative states a youth share of 39.84%; the Annex V counts yield 40.81%. The figures below follow Annex V and disclose the discrepancy rather than inventing a reconciliation.
National register: 2022
22.1m
22,120,458
Registered voters
IEBC 2022
49.12%
10,866,419
Women
of the register
50.88%
11,254,039
Men
of the register
40.81%
9,027,518
Ages 18-34
Annex V
Narrative youth share in the IEBC report: 39.84%. Annex V counts: 40.81%. Women and ages 18-34 overlap, do not add the percentages.
Former provinces, not ethnic blocs
Share aged 18-34
- North Eastern51.7% · 626,261 voters
- Nairobi44.3% · 2,415,310
- Nyanza44.0% · 3,120,732
- Rift Valley42.7% · 5,349,889
- Coast41.2% · 1,963,144
- Western40.9% · 2,217,948
- Central35.3% · 3,114,735
- Eastern35.1% · 3,294,513
Share who are women
- Nyanza51.2%
- Central50.1%
- Western50.1%
- Eastern49.5%
- Coast48.9%
- Rift Valley48.7%
- North Eastern47.5%
- Nairobi45.6%
Regional total 22,102,532 excludes 10,443 diaspora and 7,483 prison voters included nationally.
| Region | Registered voters | Ages 18-34 | Ages 35+ | Women | Men |
|---|---|---|---|---|---|
| Rift Valley | 5,349,889 | 42.7% | 57.3% | 48.7% | 51.3% |
| Eastern | 3,294,513 | 35.1% | 64.9% | 49.5% | 50.5% |
| Nyanza | 3,120,732 | 44.0% | 56.0% | 51.2% | 48.8% |
| Central | 3,114,735 | 35.3% | 64.7% | 50.1% | 49.9% |
| Nairobi | 2,415,310 | 44.3% | 55.7% | 45.6% | 54.4% |
| Western | 2,217,948 | 40.9% | 59.1% | 50.1% | 49.9% |
| Coast | 1,963,144 | 41.2% | 58.8% | 48.9% | 51.1% |
| North Eastern | 626,261 | 51.7% | 48.3% | 47.5% | 52.5% |
Rift Valley
- Registered voters
- 5,349,889
- Ages 18-34
- 42.7%
- Ages 35+
- 57.3%
- Women
- 48.7%
- Men
- 51.3%
Eastern
- Registered voters
- 3,294,513
- Ages 18-34
- 35.1%
- Ages 35+
- 64.9%
- Women
- 49.5%
- Men
- 50.5%
Nyanza
- Registered voters
- 3,120,732
- Ages 18-34
- 44.0%
- Ages 35+
- 56.0%
- Women
- 51.2%
- Men
- 48.8%
Central
- Registered voters
- 3,114,735
- Ages 18-34
- 35.3%
- Ages 35+
- 64.7%
- Women
- 50.1%
- Men
- 49.9%
Nairobi
- Registered voters
- 2,415,310
- Ages 18-34
- 44.3%
- Ages 35+
- 55.7%
- Women
- 45.6%
- Men
- 54.4%
Western
- Registered voters
- 2,217,948
- Ages 18-34
- 40.9%
- Ages 35+
- 59.1%
- Women
- 50.1%
- Men
- 49.9%
Coast
- Registered voters
- 1,963,144
- Ages 18-34
- 41.2%
- Ages 35+
- 58.8%
- Women
- 48.9%
- Men
- 51.1%
North Eastern
- Registered voters
- 626,261
- Ages 18-34
- 51.7%
- Ages 35+
- 48.3%
- Women
- 47.5%
- Men
- 52.5%
A single regional total conceals generational difference. North Eastern’s register was the youngest among the former provinces; Eastern and Central were older. Nairobi’s gender balance tipped toward men; Nyanza’s tipped toward women. Those patterns describe registration demography, not political programmes, and not ethnic blocs.
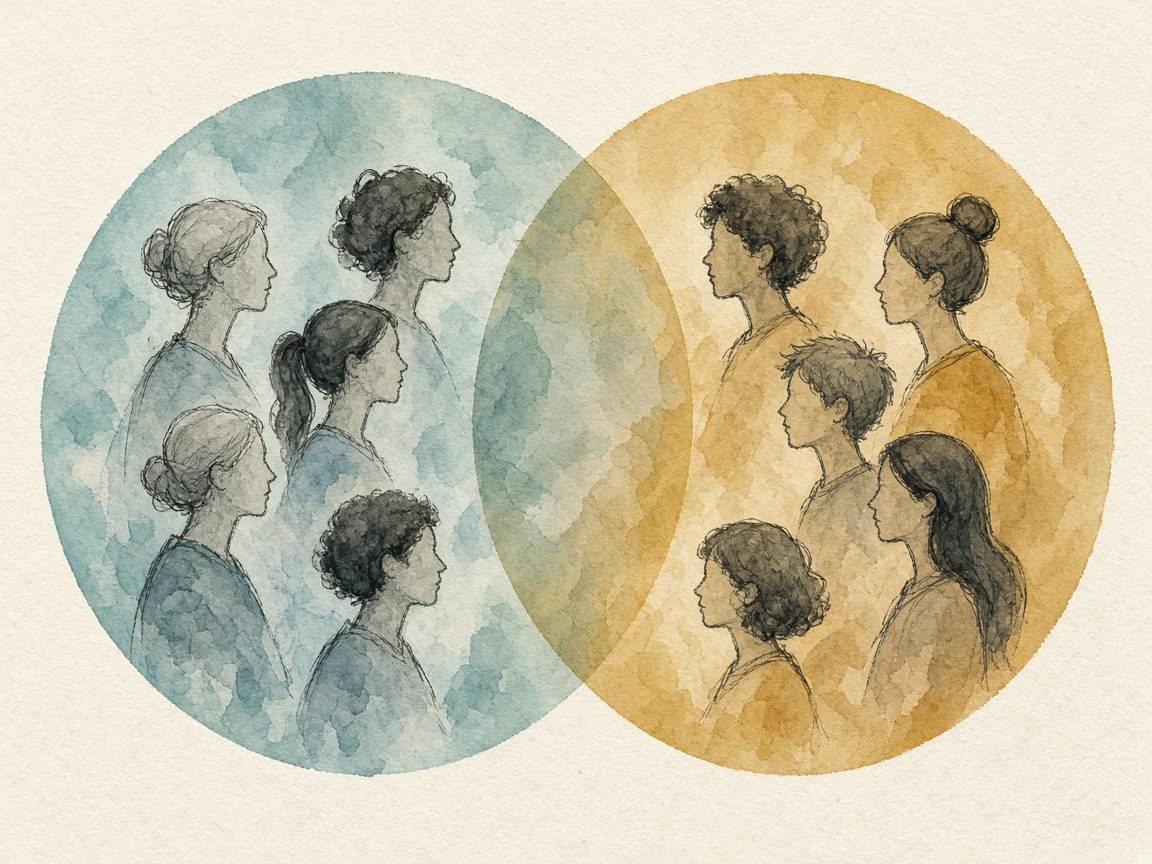
Women and young people overlap. Their percentages cannot be added to invent a larger electoral army. Neither category is politically homogeneous. A young woman trading in Gikomba and a young man seeking a first formal wage job may share an age band and still face different costs, risks and public-system failures.
Two overlapping soft circles with abstracted figures of varied ages in and between them. No statistics baked as claims.
Livelihoods Inside the Regions
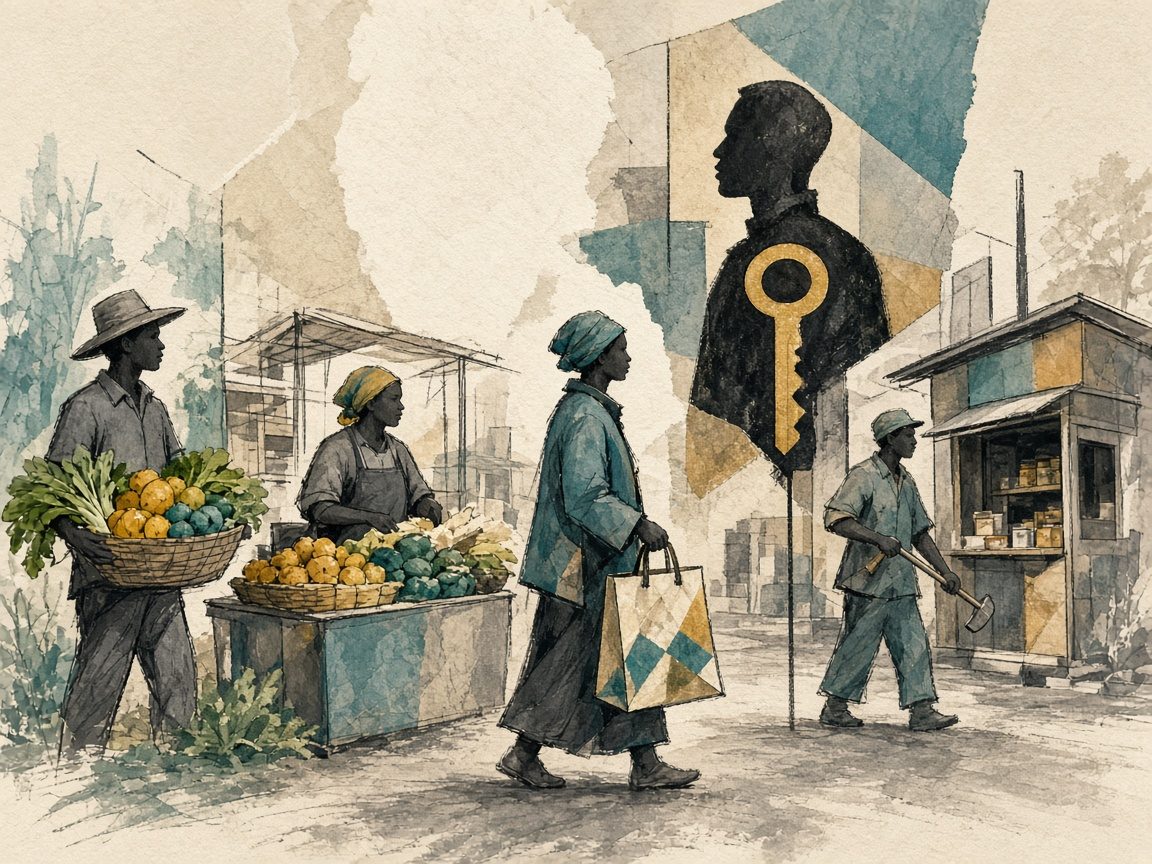
Age and gender still leave work, care and enterprise invisible. Within any region, farming, trade, manual work, professional occupations and non-work roles coexist. Landlord and tenant, employer and worker, farmer and food buyer, trader and supplier can share an ethnic identity while occupying different economic positions, or share none and still depend on the same market, road, clinic or school.
Market aisle with produce, stalls and interdependent roles. Abstracted faces; no ethnic coding of communities.
The occupation profiles below are weighted estimates from Afrobarometer Kenya Round 10 (2024). They describe surveyed adult citizens’ current or last main occupation. They are not a map of registered voters, and they do not reveal anyone’s ballot.
Current or last occupation, adults 18+ (not registered voters)
Agriculture (farming, fishing, forestry)
- Eastern35% n=368
- Nyanza32% n=296
- Rift Valley31% n=632
- Western29% n=240
- Central26% n=280
- Coast22% n=256
- North Eastern16% n=112
- Nairobi1% n=216
Trade and retail
- Nairobi34% n=216
- Coast25% n=256
- North Eastern23% n=112
- Western19% n=240
- Eastern18% n=368
- Central18% n=280
- Rift Valley16% n=632
- Nyanza16% n=296
Rounded independently; not normalised to 100%. Weighted Afrobarometer Round 10 (withinwt_hh; Q94B). Do not multiply shares by IEBC voter totals.
| Region | Sample n | Agriculture | Trade/retail | Manual/craft | Professionals | Office/security | Student/home/never worked | Other/no answer |
|---|---|---|---|---|---|---|---|---|
| Rift Valley | 632 | 31% | 16% | 20% | 9% | 1% | 22% | 1% |
| Eastern | 368 | 35% | 18% | 20% | 7% | 4% | 16% | 0% |
| Nyanza | 296 | 32% | 16% | 22% | 11% | 2% | 17% | 1% |
| Central | 280 | 26% | 18% | 20% | 11% | 3% | 21% | 1% |
| Nairobi | 216 | 1% | 34% | 30% | 10% | 7% | 19% | 0% |
| Western | 240 | 29% | 19% | 21% | 10% | 4% | 18% | <1% |
| Coast | 256 | 22% | 25% | 28% | 5% | 7% | 12% | 1% |
| North Eastern | 112 | 16% | 23% | 12% | 8% | 2% | 39% | 0% |
Rift Valley
- Sample n
- 632
- Agriculture
- 31%
- Trade/retail
- 16%
- Manual/craft
- 20%
- Professionals
- 9%
- Office/security
- 1%
- Student/home/never worked
- 22%
- Other/no answer
- 1%
Eastern
- Sample n
- 368
- Agriculture
- 35%
- Trade/retail
- 18%
- Manual/craft
- 20%
- Professionals
- 7%
- Office/security
- 4%
- Student/home/never worked
- 16%
- Other/no answer
- 0%
Nyanza
- Sample n
- 296
- Agriculture
- 32%
- Trade/retail
- 16%
- Manual/craft
- 22%
- Professionals
- 11%
- Office/security
- 2%
- Student/home/never worked
- 17%
- Other/no answer
- 1%
Central
- Sample n
- 280
- Agriculture
- 26%
- Trade/retail
- 18%
- Manual/craft
- 20%
- Professionals
- 11%
- Office/security
- 3%
- Student/home/never worked
- 21%
- Other/no answer
- 1%
Nairobi
- Sample n
- 216
- Agriculture
- 1%
- Trade/retail
- 34%
- Manual/craft
- 30%
- Professionals
- 10%
- Office/security
- 7%
- Student/home/never worked
- 19%
- Other/no answer
- 0%
Western
- Sample n
- 240
- Agriculture
- 29%
- Trade/retail
- 19%
- Manual/craft
- 21%
- Professionals
- 10%
- Office/security
- 4%
- Student/home/never worked
- 18%
- Other/no answer
- <1%
Coast
- Sample n
- 256
- Agriculture
- 22%
- Trade/retail
- 25%
- Manual/craft
- 28%
- Professionals
- 5%
- Office/security
- 7%
- Student/home/never worked
- 12%
- Other/no answer
- 1%
North Eastern
- Sample n
- 112
- Agriculture
- 16%
- Trade/retail
- 23%
- Manual/craft
- 12%
- Professionals
- 8%
- Office/security
- 2%
- Student/home/never worked
- 39%
- Other/no answer
- 0%
Formal wage employment is a narrower national context still. As at 30 June 2022, KNBS recorded about 3.0 million jobs in modern establishments. Education alone accounted for roughly one in five. That panel excludes informal work, self-employment and small-scale farming, the livelihoods many Kenyans actually live.
Formal wage jobs: 30 June 2022 (provisional)
3.015memployees in modern establishments
Share of national wage employment
- Education20.9% · 629.1k
- Manufacturing11.7% · 352.6k
- Agriculture, forestry & fishing11.3% · 341.6k
- Public administration & defence11.1% · 334.9k
- Wholesale/retail & vehicle repairs8.9% · 267.9k
- Construction7.7% · 231.7k
- Other industries28.4% · 857.6k
Excludes informal employment, self-employed and unpaid family workers, and small-scale farming/pastoralist activities. Published counts are rounded.
| Industry | Employees, thousands | Share |
|---|---|---|
| Education | 629.1 | 20.9% |
| Manufacturing | 352.6 | 11.7% |
| Agriculture, forestry and fishing | 341.6 | 11.3% |
| Public administration, defence and compulsory social security | 334.9 | 11.1% |
| Wholesale/retail trade and vehicle repairs | 267.9 | 8.9% |
| Construction | 231.7 | 7.7% |
| Other industries | 857.6 | 28.4% |
| Total | 3,015.4 | 100.0% |
Education
- Employees, thousands
- 629.1
- Share
- 20.9%
Manufacturing
- Employees, thousands
- 352.6
- Share
- 11.7%
Agriculture, forestry and fishing
- Employees, thousands
- 341.6
- Share
- 11.3%
Public administration, defence and compulsory social security
- Employees, thousands
- 334.9
- Share
- 11.1%
Wholesale/retail trade and vehicle repairs
- Employees, thousands
- 267.9
- Share
- 8.9%
Construction
- Employees, thousands
- 231.7
- Share
- 7.7%
Other industries
- Employees, thousands
- 857.6
- Share
- 28.4%
Total
- Employees, thousands
- 3,015.4
- Share
- 100.0%
What the Evidence Cannot Establish
The ecological error is ordinary and costly: assume that everyone in a region has the characteristics or preferences attributed to the region’s average. A registration share is not an identity census. An occupation estimate for adults is not a voter classification. A national formal-wage industry table is not a regional livelihood map.
Large stamp descending toward varied silhouettes; some figures already outside the imprint. Metaphor for ecological fallacy.
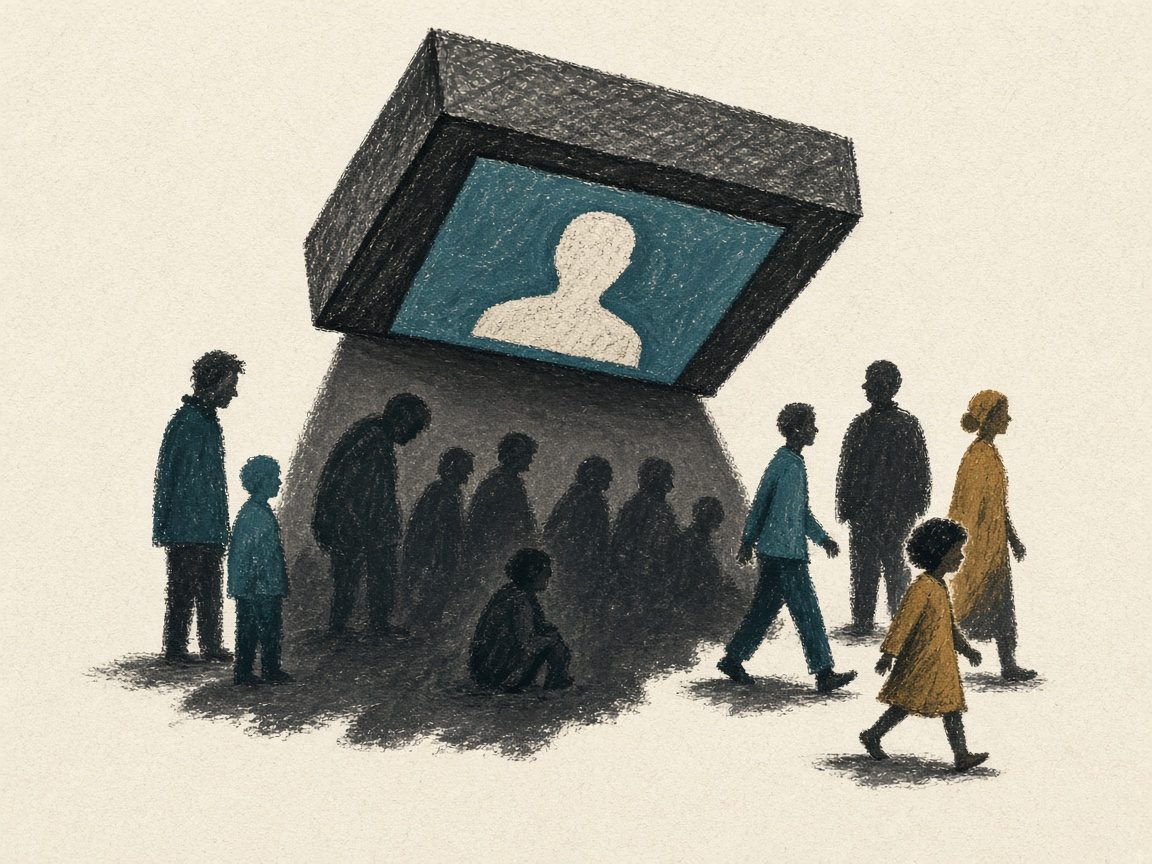
Occupation percentages are rounded independently and may not total 100%. Regional survey samples are smaller than the national sample; North Eastern’s n of 112 is especially thin. None of these datasets authorises a claim that economic interest has replaced ethnicity, or that any leader owns a province’s votes.
Shared Systems, Not Owned Blocs
In From Ethnic Geography to Convivial Democracy, I argued that Kenyans already share systems, markets, transport, food, health, learning, enterprise, even when electoral language freezes geography into tribe. The point is not to replace ethnic blocs with occupational tribes. A useful public conversation includes the disagreements inside a shared system: who pays, who waits, who captures value, who bears risk.
Cultural belonging can coexist with independent judgment. Demanding accountable representation is not a demand that people forget where they come from. It is a demand that counting stop pretending to be ownership. Related arguments on electoral geography appear in The Map Is Also a Ballot; on party rules and coalition bargains, in The Party Is Also a Map; on lived evidence, in Mzungu Research vs Mwafrika Research.
From Numbers to Commitments
If citizens are more than regional cargo, representation needs a practice that travels from circumstance to delivery. The Living Constituency Commons is one such organising proposition, not a claim that the platform has already settled Kenya’s accountability problems.
A practical sequence
- Document a shared challenge.
- Hear the different people affected.
- Identify the responsible institution.
- Establish a specific commitment.
- Record resources, responsibility and timing.
- Examine evidence of delivery.
- Allow citizens to question results and seek revision.
Which problem will be addressed? Who benefits, and who bears the cost? Which institution is responsible? What resources are available? By when should change be visible? What evidence will allow citizens to judge delivery?
Three connected civic scenes: counting, listening circle, and a commitment timeline. No party symbols or candidate portraits.
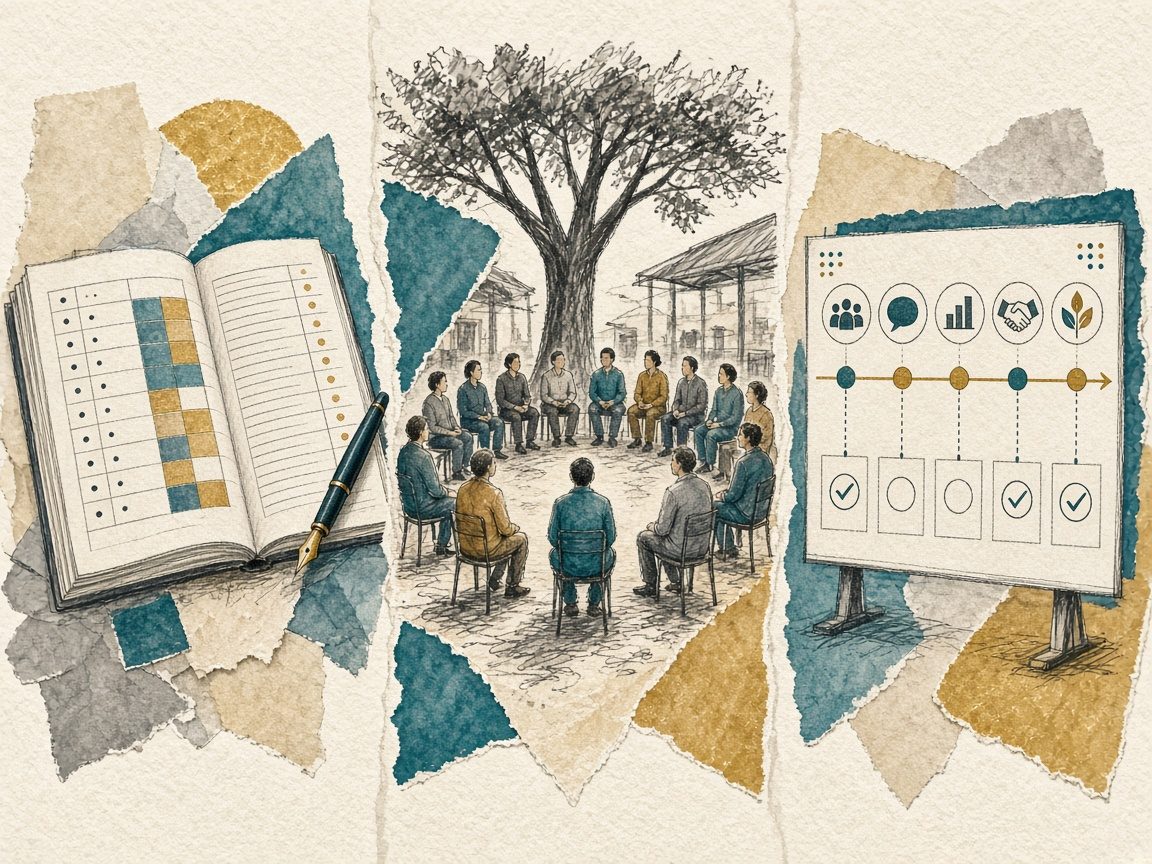
What shared public problem connects your neighbourhood, workplace or market? Document the challenge, bring affected voices together through community listening, shape priorities in the Civic Compact, and enter the Living Constituency Commons where delivery can be checked.
Count us accurately. Listen to us carefully. Then account to us.
Sources and Methodology
- IEBC, 2022 Post Election Evaluation Report, Annexes IV-V (printed pages 155-158): original report; archived copy. (accessed 11 September 2026)
- Afrobarometer: Kenya Round 10 (2024) dataset; codebook; questionnaire. Regional occupation profiles are calculations from the microdata (Q94B; weight withinwt_hh), distinct from IEBC administrative registration counts. (accessed 11 September 2026)
- KNBS, Economic Survey 2023, Tables 3.2 and 3.4 (printed pages 58-61): accessible mirror. National formal wage employment only; provisional as published. (accessed 11 September 2026)
From reading to civic action
Regional totals are not ownership. Document a shared public problem, bring affected voices together, and track a commitment whose delivery can be checked.
Improve this article
Ask a question, suggest a correction, submit a source, share experience, or propose a topic. Contact details stay private. Publicly consequential allegations need editorial review.